astropy.ndarray#
[1]:
%pylab inline
import warnings
warnings.filterwarnings("ignore")
%pylab is deprecated, use %matplotlib inline and import the required libraries.
Populating the interactive namespace from numpy and matplotlib
1D array - spectra#
[ ]:
2D array - image#
[ ]:
3D array - cube#
SDSS-MaNGA is an IFS survey of galaxies.
Example data: 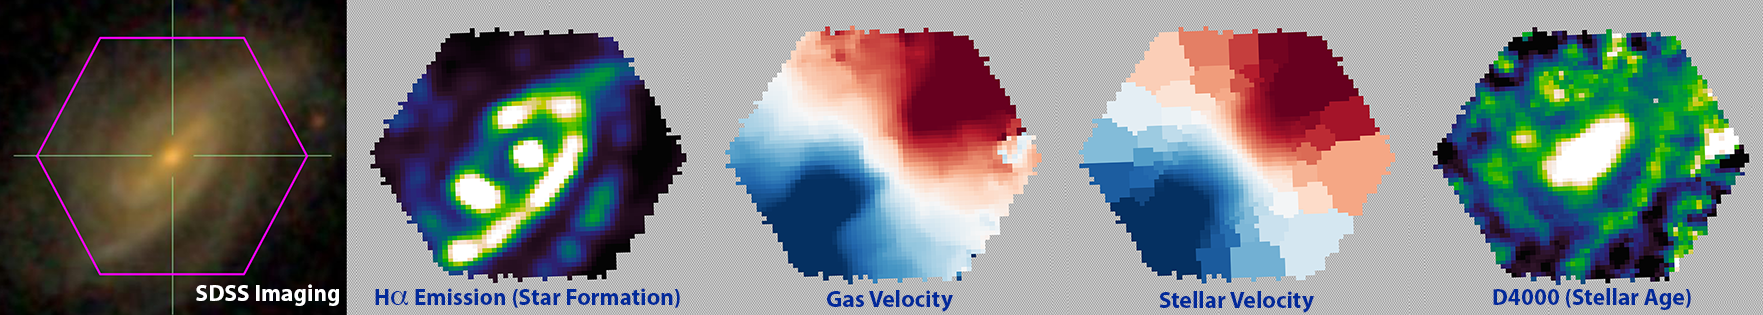
[2]:
# load MaNGA data
from astropy.io import fits
hl = fits.open("../../../examples/astronomical_data_cube/manga-7443-12701-LOGCUBE.fits.gz")
hl.info()
Filename: ../../../examples/astronomical_data_cube/manga-7443-12701-LOGCUBE.fits.gz
No.    Name      Ver    Type      Cards   Dimensions   Format
  0  PRIMARY       1 PrimaryHDU      75   ()
  1  FLUX          1 ImageHDU       100   (72, 72, 4563)   float32
  2  IVAR          1 ImageHDU        17   (72, 72, 4563)   float32
  3  MASK          1 ImageHDU        17   (72, 72, 4563)   int32
  4  LSFPOST       1 ImageHDU        11   (72, 72, 4563)   float32
  5  LSFPRE        1 ImageHDU        11   (72, 72, 4563)   float32
  6  WAVE          1 ImageHDU         9   (4563,)   float64
  7  SPECRES       1 ImageHDU         9   (4563,)   float64
  8  SPECRESD      1 ImageHDU         9   (4563,)   float64
  9  PRESPECRES    1 ImageHDU         9   (4563,)   float64
 10  PRESPECRESD    1 ImageHDU         9   (4563,)   float64
 11  OBSINFO       1 BinTableHDU    148   15R x 65C   [25A, 17A, 5A, J, I, 9A, E, E, E, E, E, E, J, J, I, J, E, 12A, J, 8A, E, E, E, E, E, E, E, E, E, E, E, E, E, E, E, E, E, E, E, 13A, E, E, E, E, D, D, D, D, E, E, J, J, J, E, E, E, E, E, E, J, J, E, E, E, E]
 12  GIMG          1 ImageHDU        28   (72, 72)   float32
 13  RIMG          1 ImageHDU        28   (72, 72)   float32
 14  IIMG          1 ImageHDU        28   (72, 72)   float32
 15  ZIMG          1 ImageHDU        28   (72, 72)   float32
 16  GPSF          1 ImageHDU        28   (72, 72)   float32
 17  RPSF          1 ImageHDU        28   (72, 72)   float32
 18  IPSF          1 ImageHDU        28   (72, 72)   float32
 19  ZPSF          1 ImageHDU        28   (72, 72)   float32
 20  GCORREL       1 BinTableHDU     32   147136R x 5C   [J, J, J, J, D]
 21  RCORREL       1 BinTableHDU     32   141085R x 5C   [J, J, J, J, D]
 22  ICORREL       1 BinTableHDU     32   144491R x 5C   [J, J, J, J, D]
 23  ZCORREL       1 BinTableHDU     32   146146R x 5C   [J, J, J, J, D]
[3]:
import matplotlib.pyplot as plt
from astropy.wcs import WCS
wcs = WCS(hl["FLUX"].header)
flux_sum = hl["FLUX"].data.sum(axis=0)

plt.figure()
plt.subplot(projection=wcs.dropaxis(2))
plt.imshow(np.log10(flux_sum), cmap=plt.cm.magma)
plt.grid(color='white', ls='solid')
plt.xlabel('R.A.')
plt.ylabel('Dec.')

[ ]: